TopMap Micro.View®+
新一代光学表面轮廓仪
新一代光学表面轮廓仪
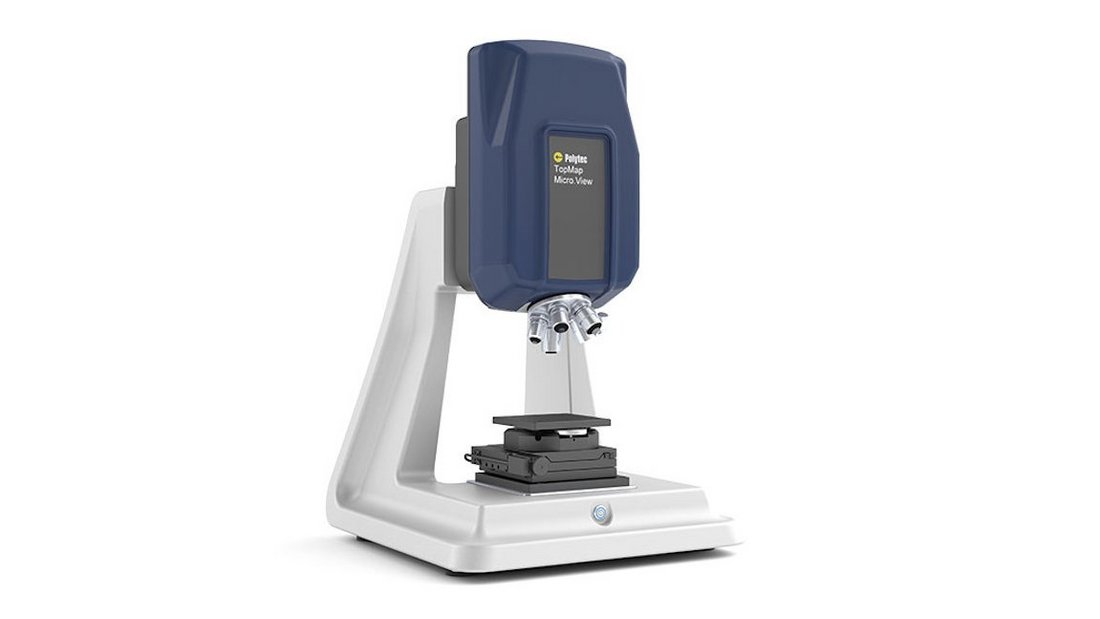
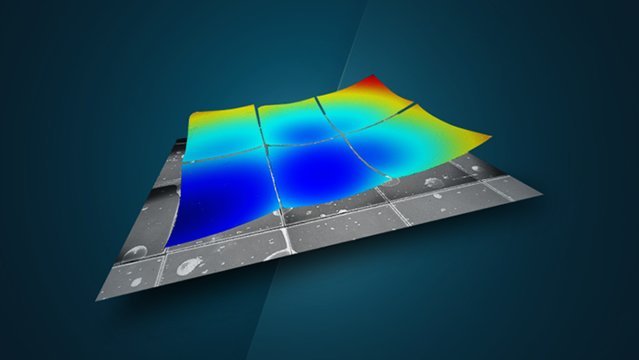
TopMap Micro.View+ 是新一代光学表面轮廓仪。 该模块化工作站专为模块化设计,可进行定制和特定于应用的配置。 MICRO.VIEW +提供了最详细的表面粗糙度,纹理和微观结构形貌分析。 结合3D数据和颜色信息结合起来,实现惊人的可视化和扩展分析,如缺陷的详细文档。 高分辨率500万像素相机提供了令人难以置信的工程表面3D数据可视化。
TopMap Micro.View是您可以信赖的精密测量技术。相信我们的经验,相信我们的专业知识,相信我们的专家。了解更多关于产品研发的幕后故事。快来加入我们的旅程吧
亮点
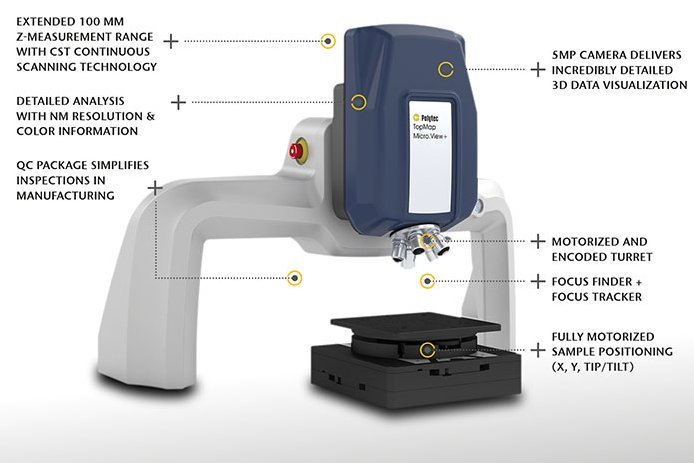
- 纳米级分辨率的高端白光干涉仪
- 采用CST连续扫描技术可达到100毫米垂直测量范围
- 配有自动“对焦仪”和“对焦跟踪器”进行自动化
- 电动X,Y,Z,倾斜调平台和转塔无需再重新定位
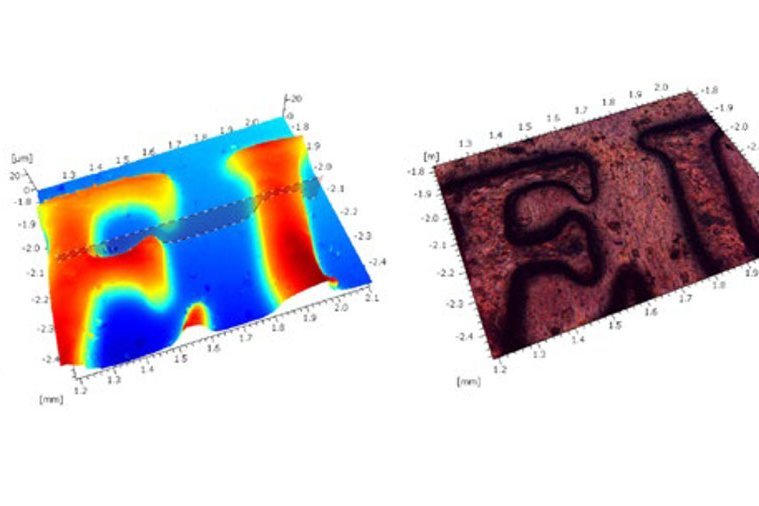
- 用于缺陷扩展分析和文档记录的颜色信息模式
- 模块化,特定于应用程序的配置




启用自动化且可投入生产线
编码和电动转塔确保了物镜之间的无缝过渡。 Micro.View+ 采用最新的“对焦仪”和“焦点追踪器”,使表面在任何情况下都保持聚焦。 采用全电动的样品定位台可实现缝合和自动化。
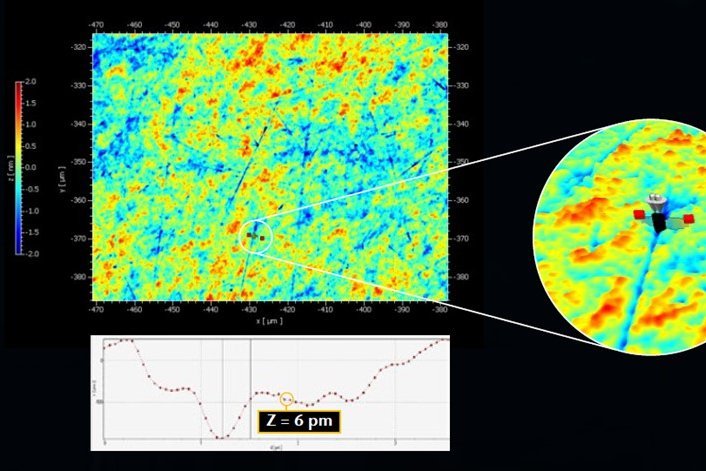
以 3D 方式表征小细节和微观结构,以亚纳米分辨率评估区域表面粗糙度 Sa,并以干涉精度评估甚至陡峭的角度。 Micro.View 和 Micro.View+ 是基于相干扫描技术 (CSI) 的表面轮廓仪,无论物镜放大倍数如何,都能提供出色的垂直分辨率。采用连续扫描技术 (CST)、100 毫米 Z 轴行程和 100 毫米相等的垂直测量范围、高达 5 MP 的相机、从 2.5X(0.6X!)到 111X 的各种物镜,包括长工作距离选项和玻璃补偿,并预设ISO参数包括ISO 25178、ASME B46.1、ISO 4287、ISO 13565、ISO 21920...
Dear visitor, in order to be able to watch our videos please accept the cookies. All information about the usage of cookies can be found in our privacy policy
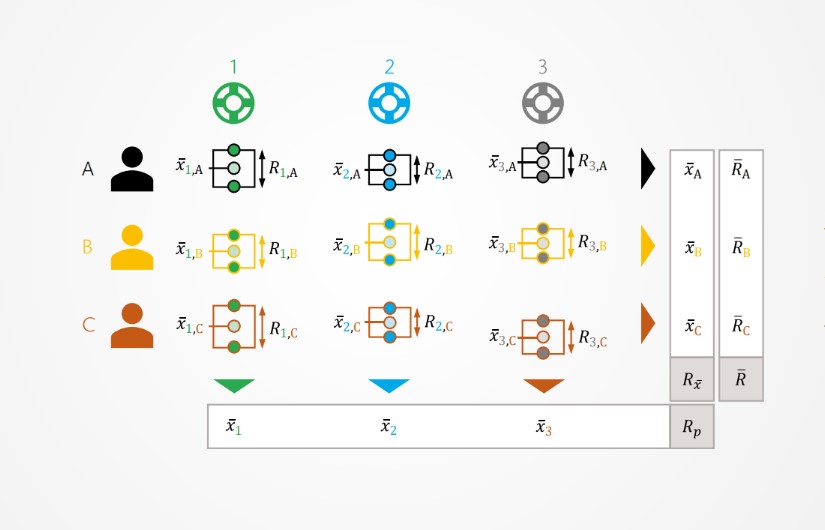


指导原则: 测量系统分析基础
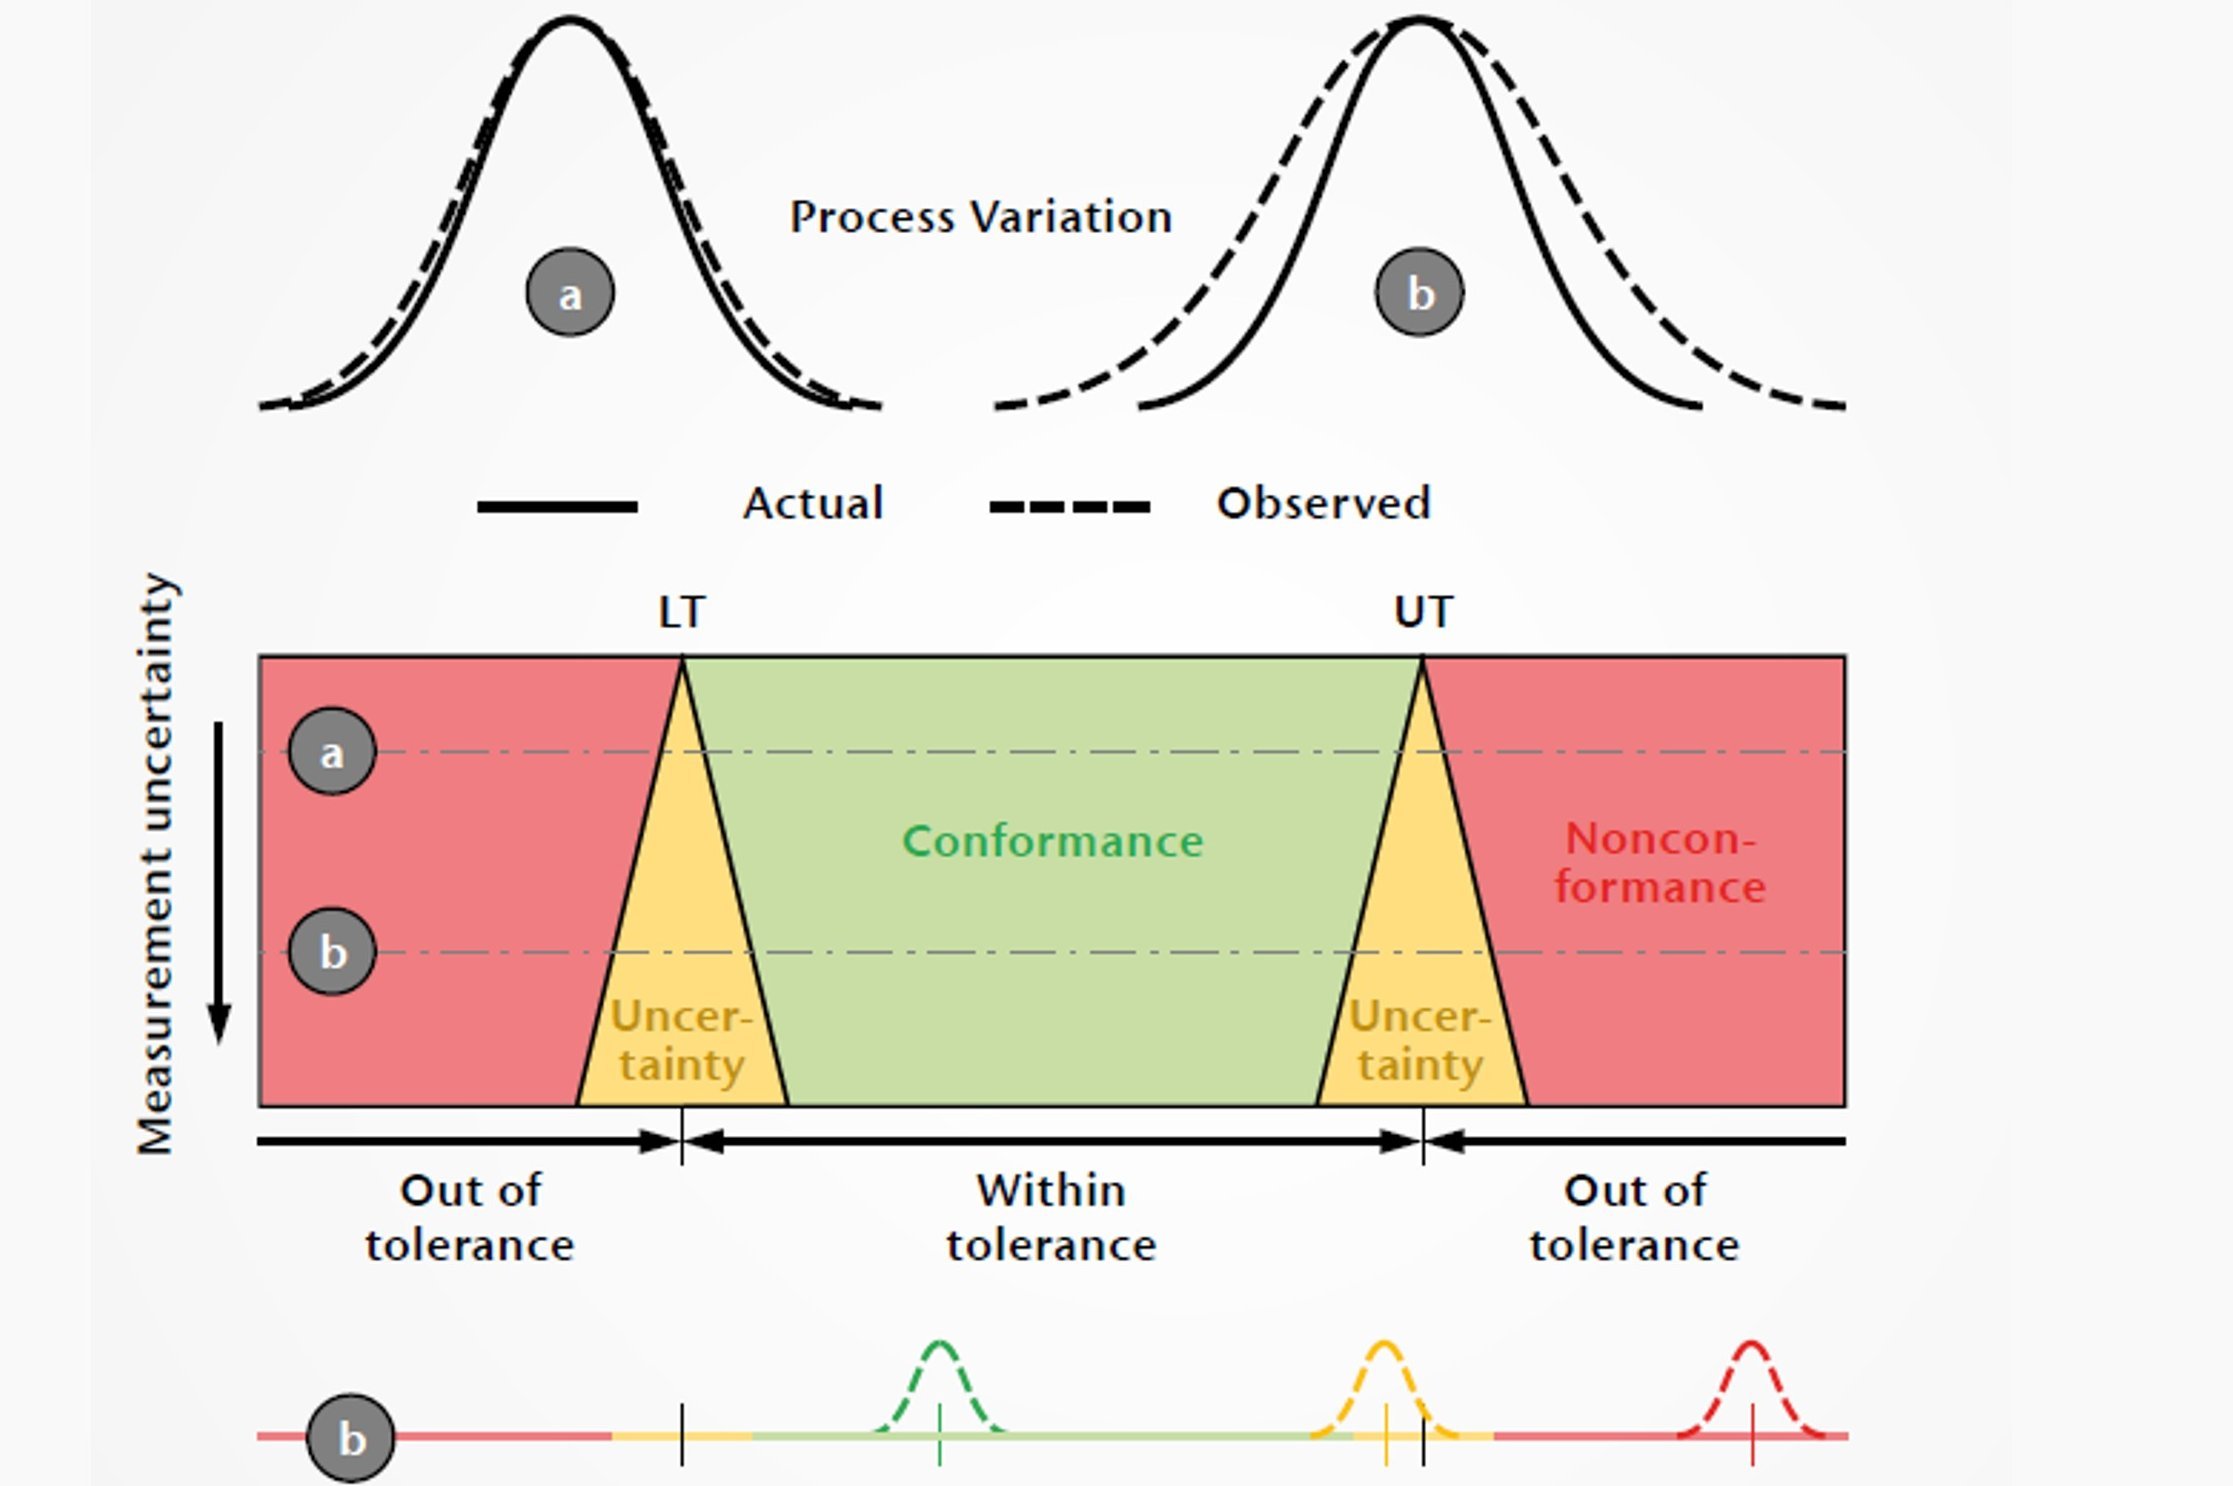
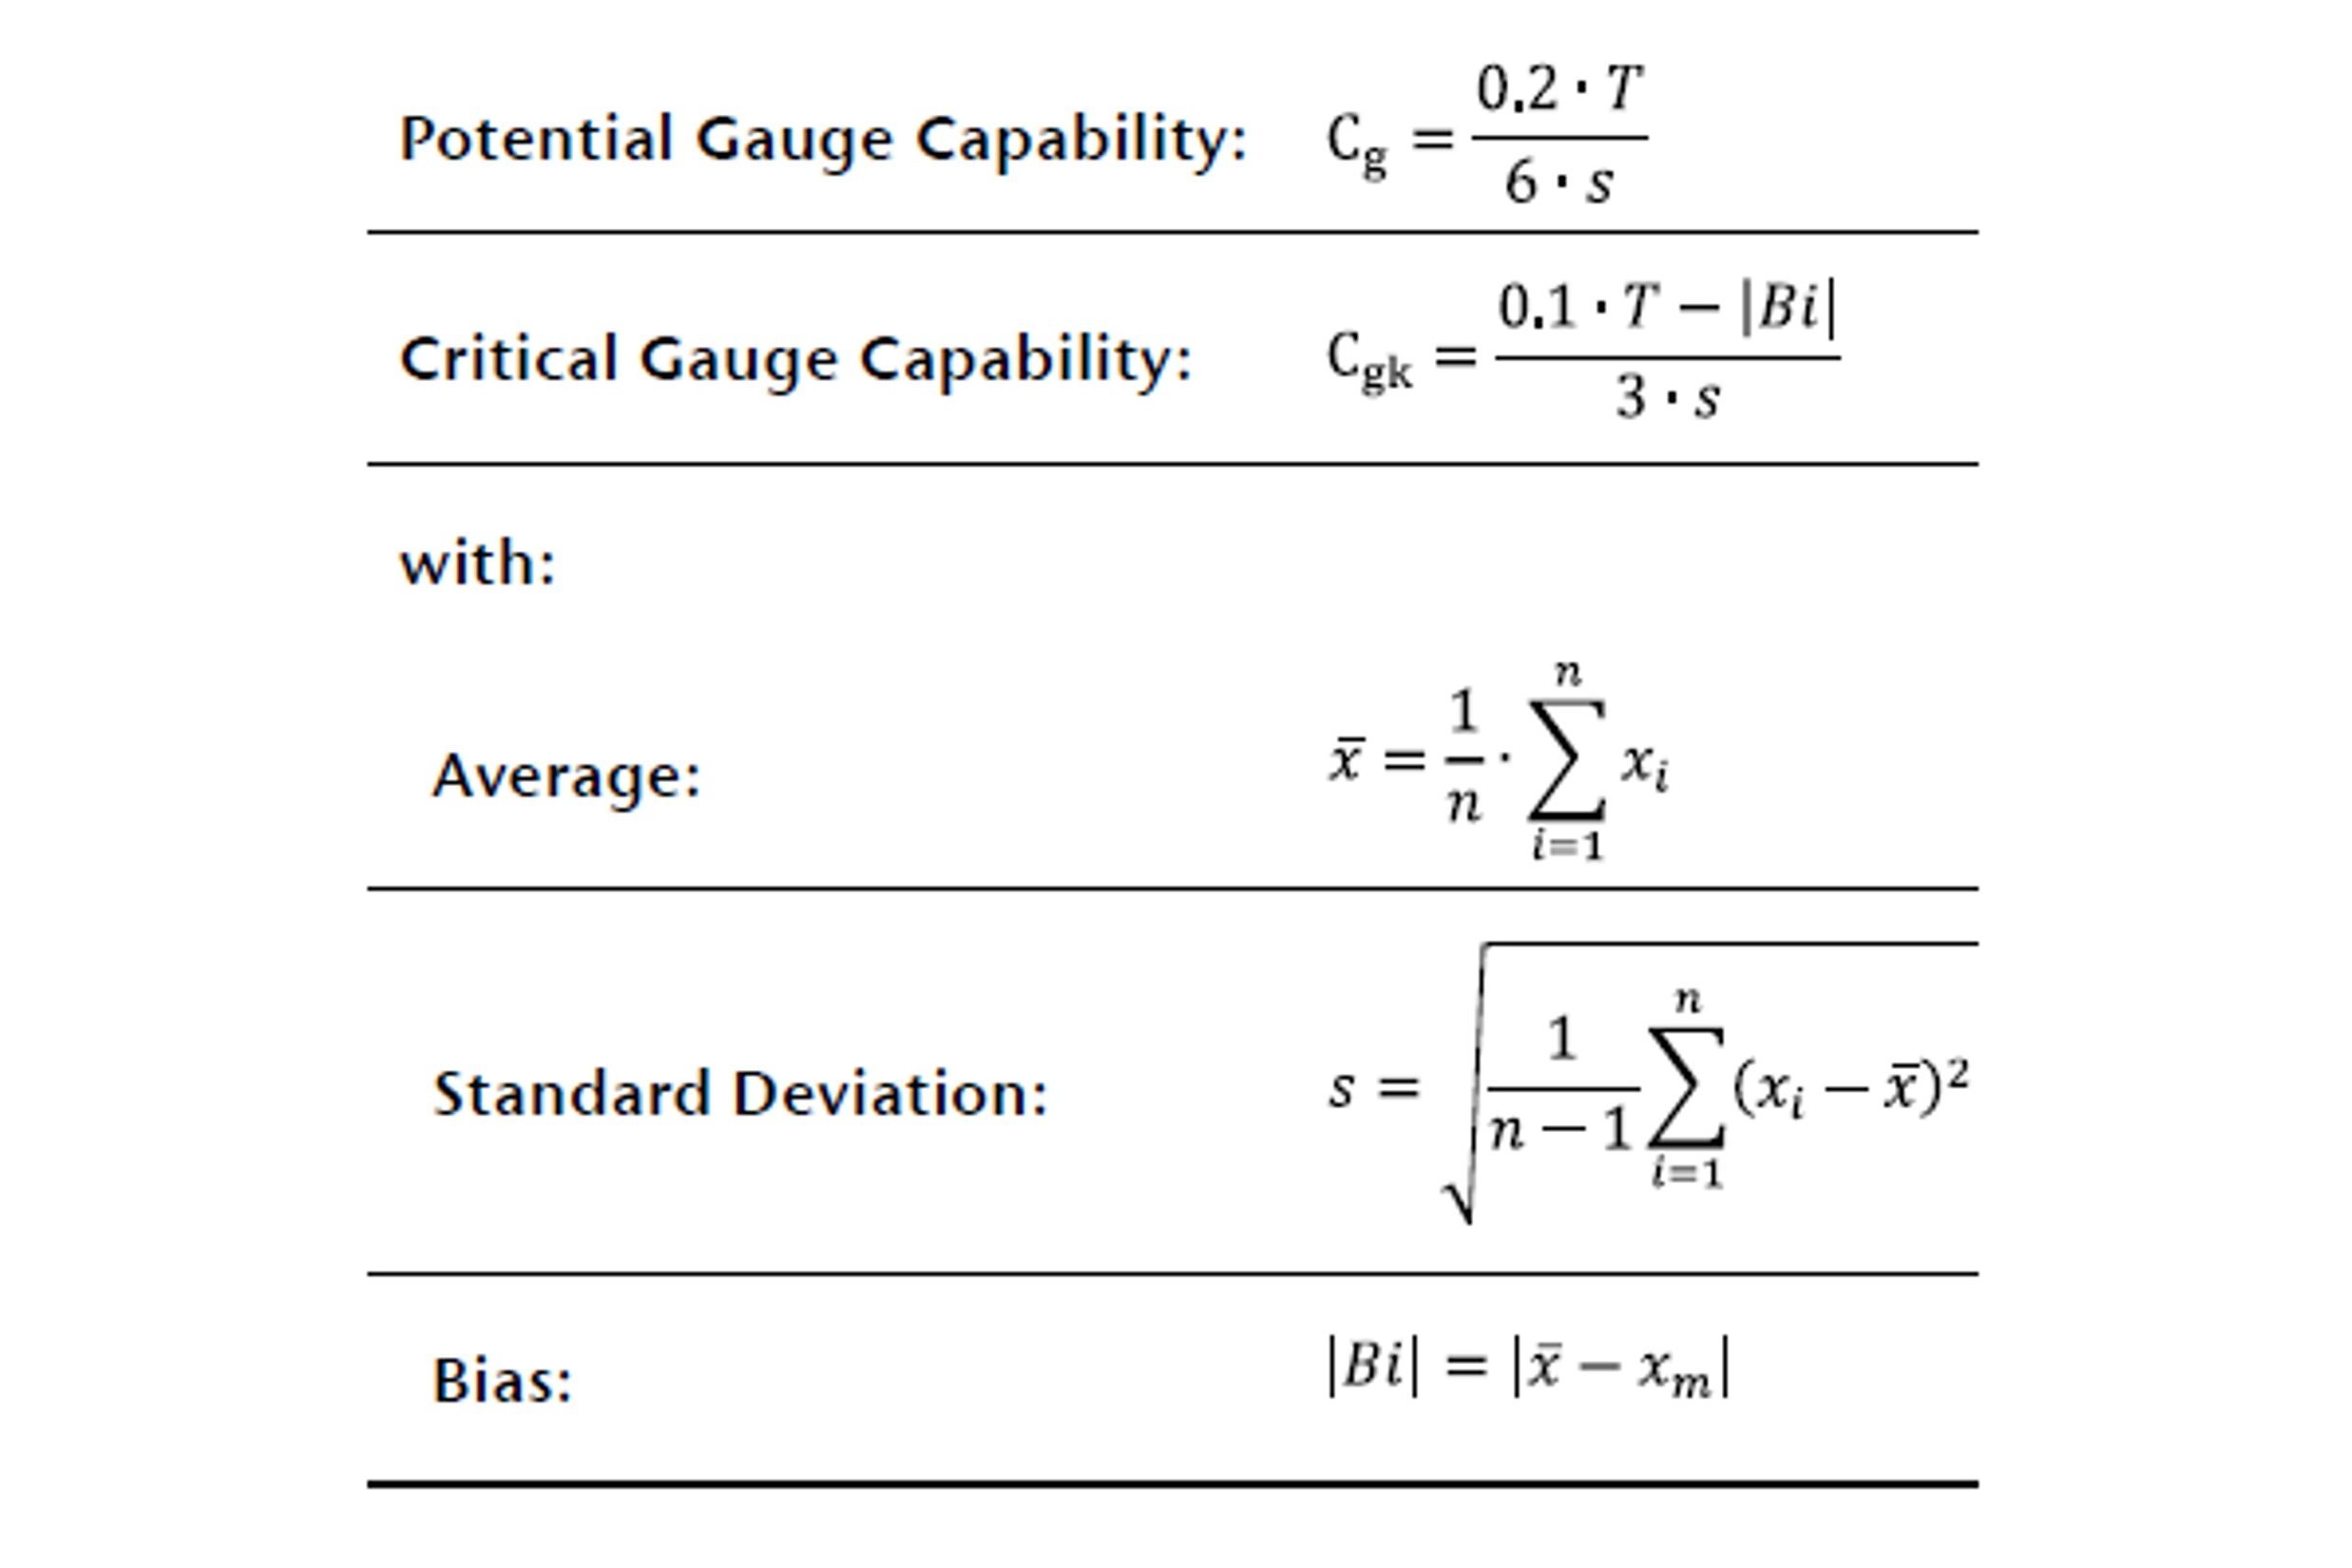
无论是触觉式还是光学式表面轮廓仪,每次测量都存在不确定性。获得的测量值是质量控制生产的基础,因此也是质量保证的关键组成部分。然而,通过测量得出的任何结论是否正确,不仅取决于参数是否合适,还取决于测量值能否准确可靠地反映实际情况。只有在测量值的不确定性与特性公差的关系足够小的情况下,测量过程才适合检测任务。本文介绍了测量系统分析 (MSA) 的方法和有用的能力数据。
在免费指南中了解如何处理质量保证中的测量不确定性!
Dear visitor, in order to be able to watch our videos please accept the cookies. All information about the usage of cookies can be found in our privacy policy
Polytec: 超越计量的性能
精密测量与经验、专业知识以及我们信赖的专家和技术息息相关。看看幕后的故事,了解更多有关 TopMap 的开发和幕后人员的信息,认识 PolyXperts。加入我们的旅程吧!
相关产品
TopMap Micro.View
TopMap Micro.View是易于使用且紧凑的光学轮廓仪。 选择Micro.View作为具有成本效益的质量控制解决方案,用于精密工程的表面分析,检查粗糙度,微结构和更多表面细节。
TopMap Pro.Surf+
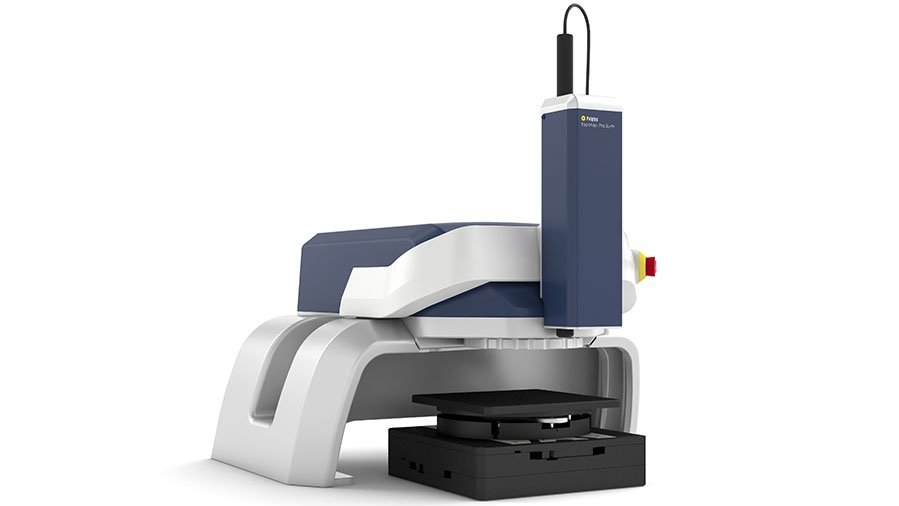
Polytec 新的一体化系统。白光干涉仪的精度,加上色彩共焦传感器,足以克服一台装置上已确定的形状偏差和任意粗糙度。Pro.Surf + 用于测量大面积外形,并且在这样做时,还可以表征纳米分辨率的结构。
TMS Software
Polytec 地形测量系统(TMS)的 TMS 软件提供了许多可能性,可以更轻松,更快地评估您的结果。
TopMap QC Package
See this new package of smart features for quality control (QC) tasks! Now available for TopMap 3D surface profiling systems, supporting surface inspections especially in challenging industrial environments.
