
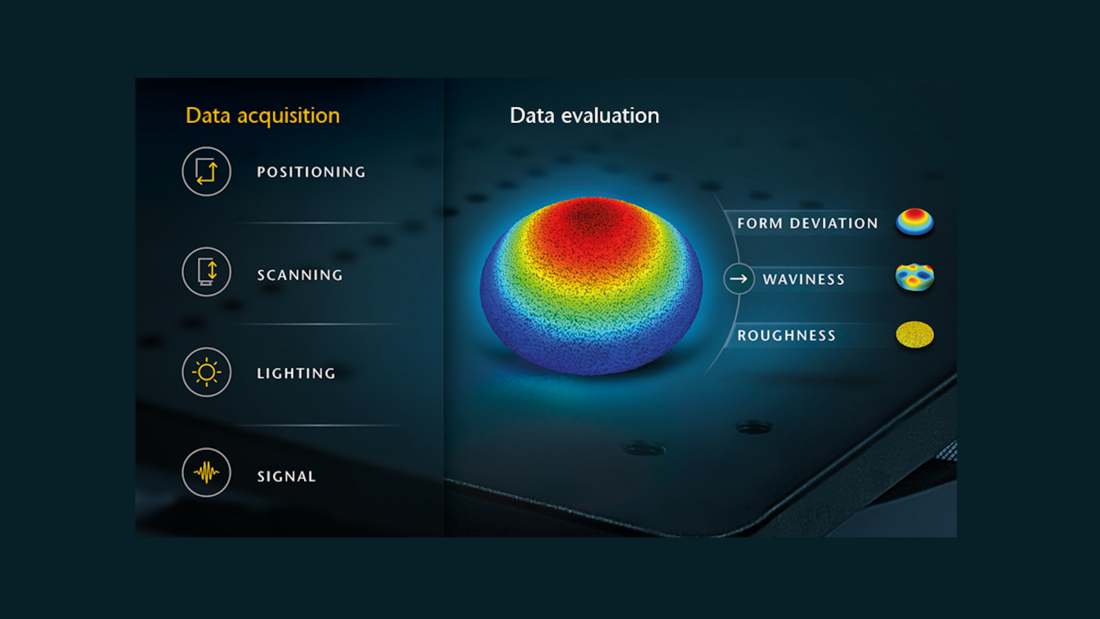
Capture, evaluate and analyze surface data
Our mission is to provide intuitive and efficient measurement systems. Based on this promise, our comprehensive measurement and analysis software enables easy filtering and analysis of your measured data. For the automated analysis of routine measurement tasks, the open software architecture also offers application-specific and user-configurable interfaces. Any more questions? The TMS report packages expand the large range of functions of the TMS Software, allowing convincing briefings and vivid presentations. Contact us!

TopMap QC Package
See this new package of smart features for quality control (QC) tasks! Now available for TopMap 3D surface profiling systems, supporting surface inspections especially in challenging industrial environments.
Operator Interface
Especially for close-to-manufacturing applications where multiple samples are handled, the software module QC Operator Interface guides the operator and greatly simplifies quality control (QC) of precision surfaces.

TMS Software
The TMS Software for Polytecs topography measurement systems of the TopMap series offers a wide range of features and options for quick and easy routine measurements but also for your extensive and detailed surface analysis.

TMS Viewer
Are you looking for a convenient way to quickly share your measurement results with your colleagues and project partners? TMS Viewer is the viewing tool for TopMap measurement systems, in case the full version of TMS Software is not installed.

Polytec Update
Polytec Update is a software tool that provides your Polytec products with the latest software releases and hotfixes. Polytec Update therefore always keeps you posted when there are updates for your Polytec measurement or desktop software – to ensure reliable measurement results and smooth working with Polytec products.
 the measurement uncertainty (b > a) leads to an increase in the observed process variation as well as in the areas at the tolerance limits in which no reliable decision can be made.")
")

Free guide on how to: Measurement System Analysis
Every measurement - whether with tactile or optical surface profilers - is subject to uncertainty. The measured values obtained are the basis for quality-controlled production and are thus a key component of quality assurance. However, the correctness of any conclusion drawn by a measurement depends not only on the suitability of the parameter, but also on how accurately and how reliably the measured values reflect the real conditions. Only if the measured value can be determined with a sufficiently small uncertainty in relation to the tolerance of the characteristic, the measurement process is suitable for the inspection task. This paper describes approaches and helpful capability figures of Measurement System Analysis (MSA).
Read in the free guide how to deal with measurement uncertainty for your Quality Assurance!