Definition of modal analysis
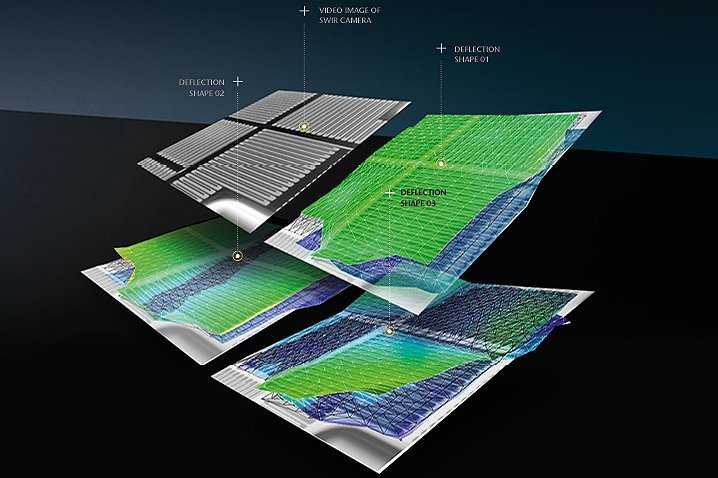
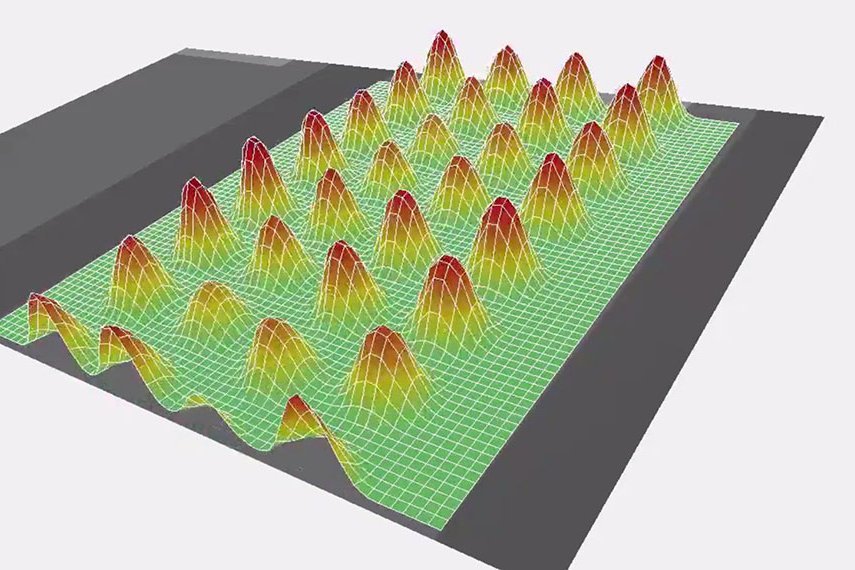
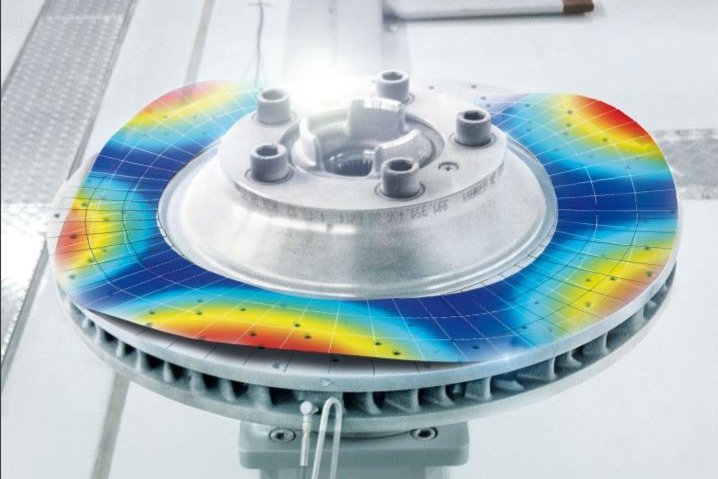
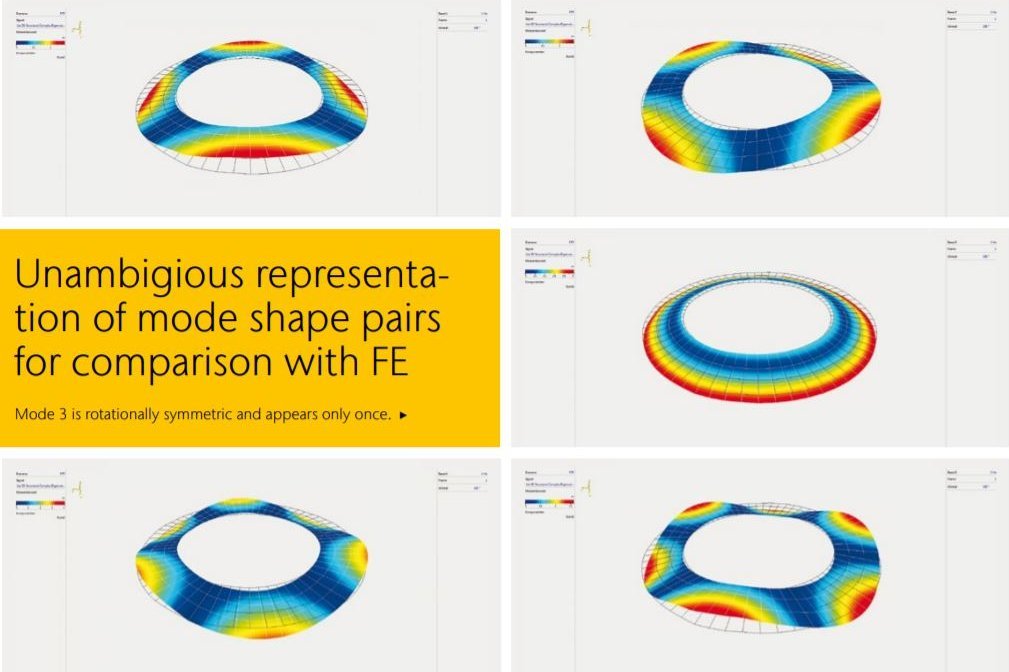
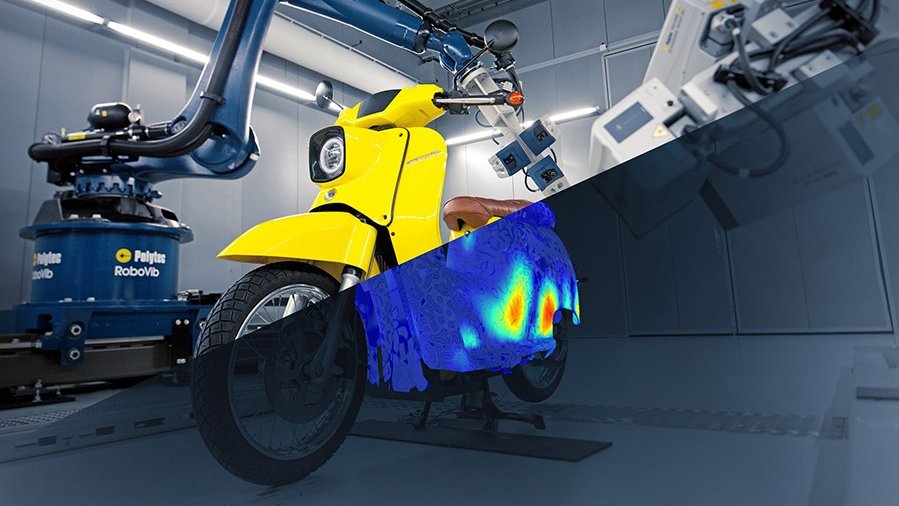
Modal analysis is the process of finding the inherent natural vibration properties of a structure. If these are known, all complicated vibrations that the structure can undergo as a response to a certain excitation, can be expressed as a superposition of these natural vibration states. Therefore, if the natural vibration states are known, much of the vibration behavior of a structure can be predicted. A natural vibration state is defined by its mode shape, its natural frequency and the associated damping.
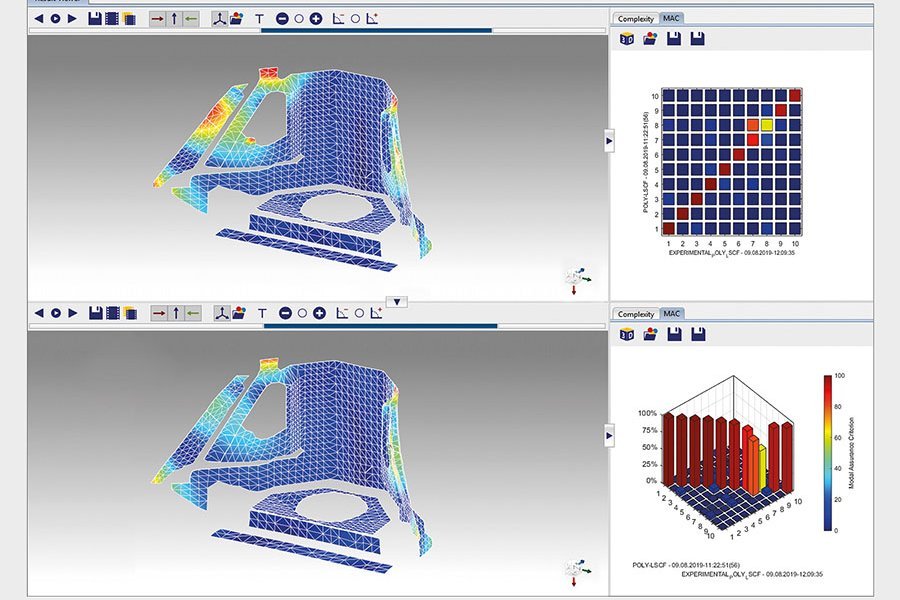
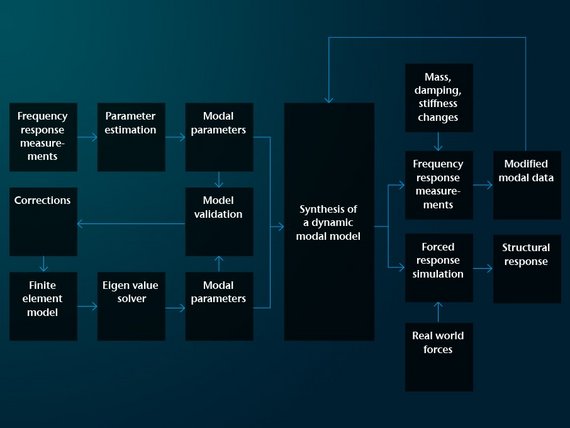
Vibration modes of a structure can be either purely simulated, e.g. from Finite Element (FE) Models or can be derived out of physical measurement results by fitting a mathematical model to these results. This latter process is called experimental modal analysis.
Experimental modal analysis and modal testing
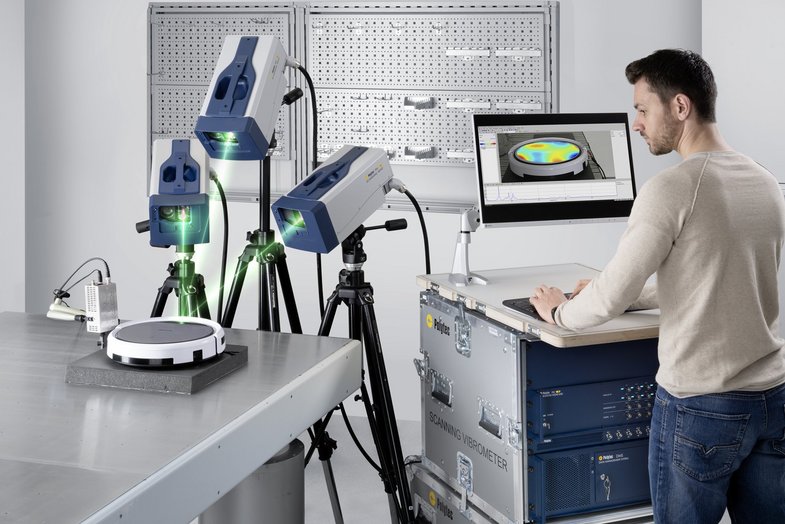
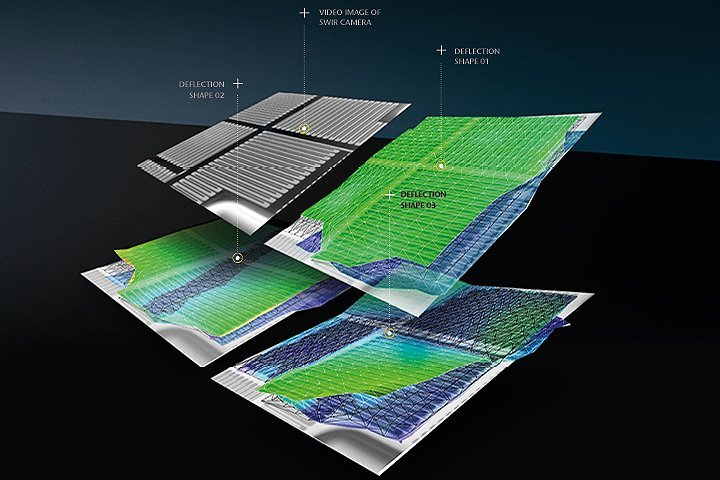
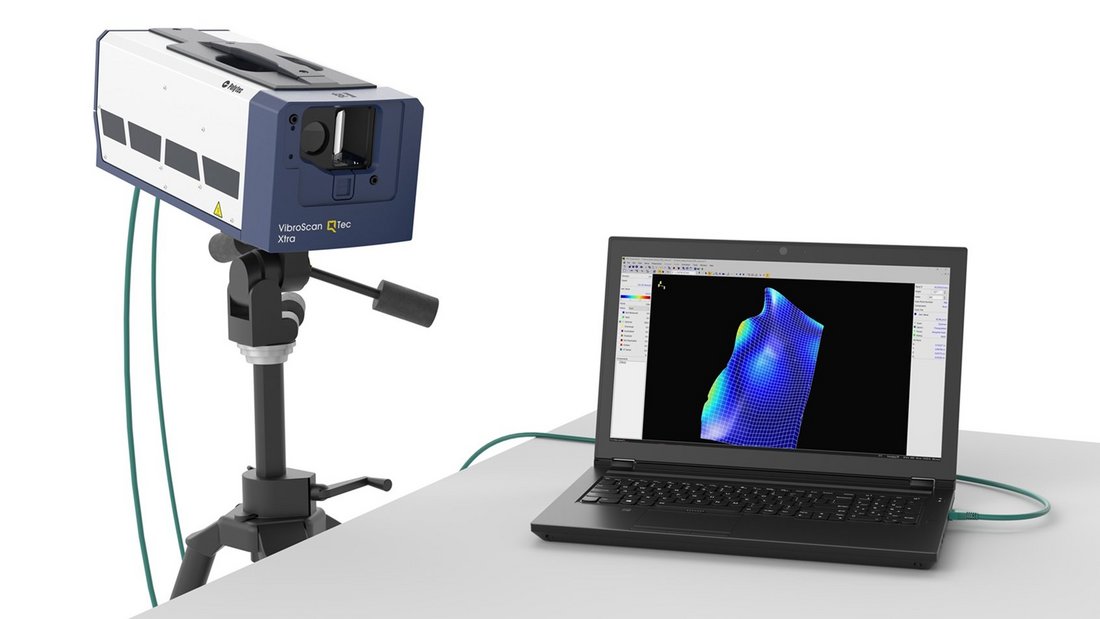
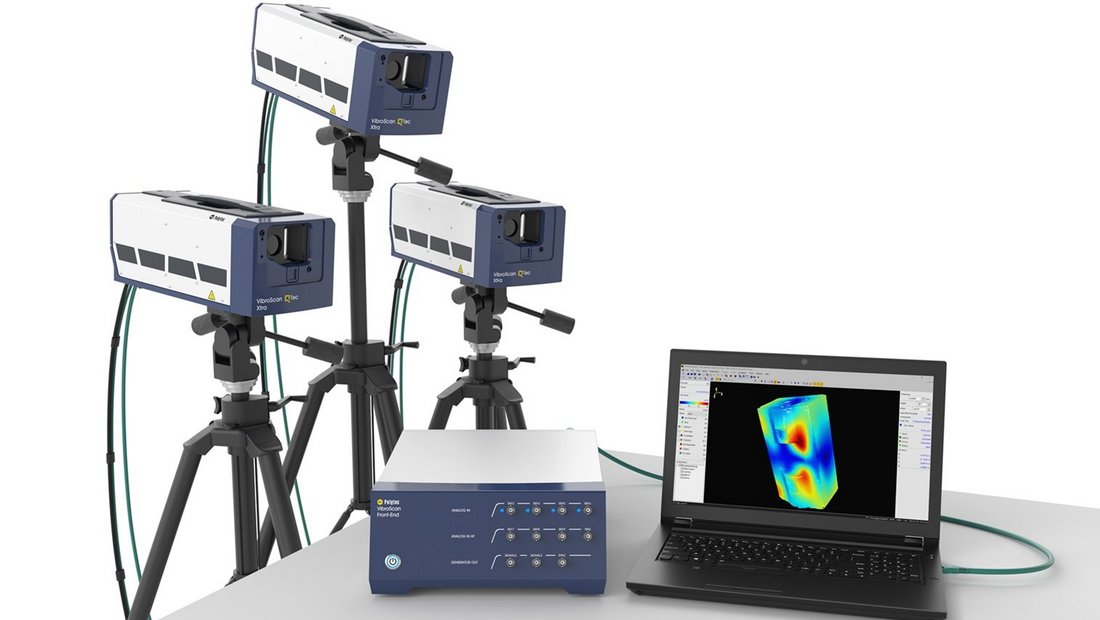
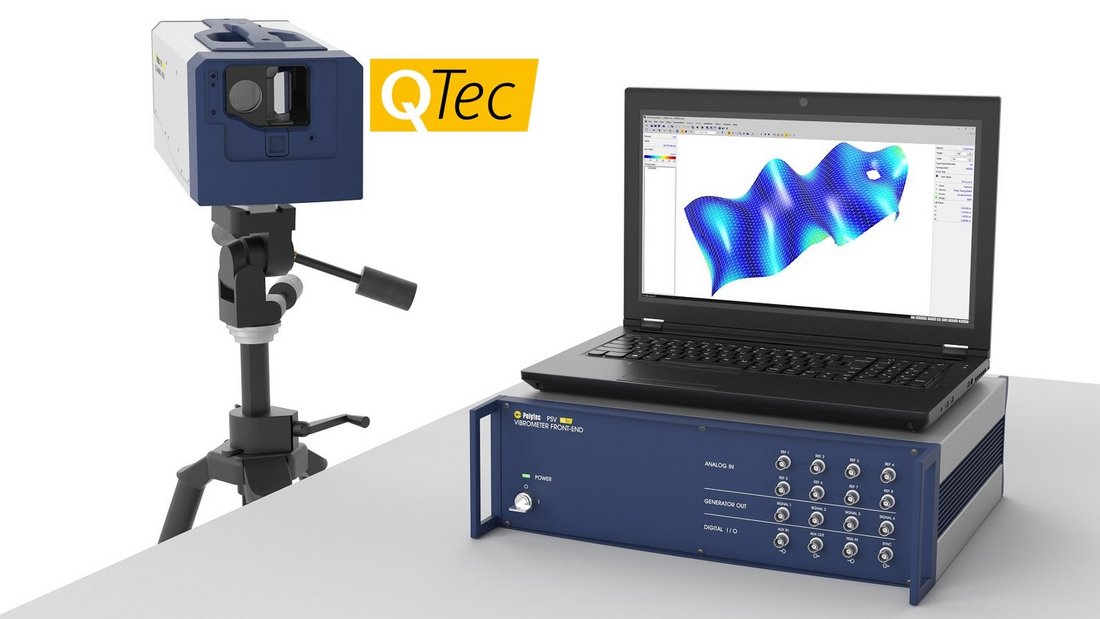
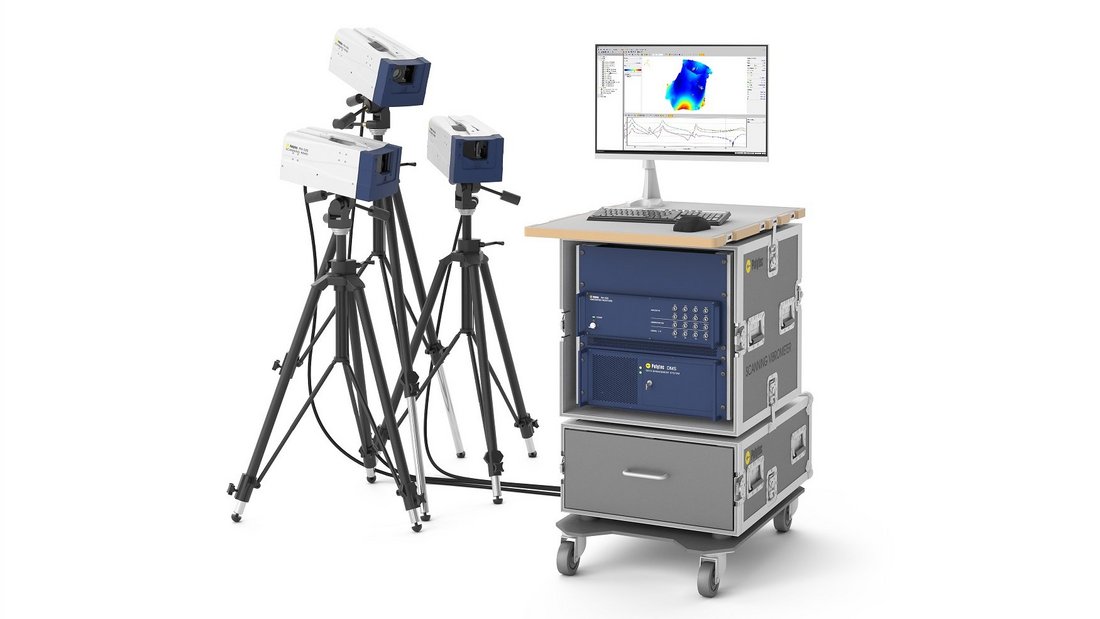
Modal analysis is a method to describe a vibrating structure in terms of its natural characteristics which are the frequency, damping and mode shapes – its dynamic properties. A standard setup for experimental modal testing requires sensor technology (force transducers, accelerometers, cameras or non-contact laser vibrometers), data acquisition and a computer for monitoring and analyzing the measurement data (DAQ). Without using a rigorous mathematical treatment, the linked whitepaper introduces some basic concepts about structural vibration and mathematical approaches for solving structural dynamics issues. Please sign up for downloading the free whitepaper.
Polytec Magazine
Experimental modal analysis of gear wheels
Measurements using broadband piezoelectric excitation
Brake discs on the test station
Experimental modal test with laser vibrometers
Laser vibrometry in the development of turbochargers for ship engines
Exciting forces
on self-supporting and self-aligning compact shakers
Experimental modal analysis of lightweight structures
How can we help you?
Excitation in experimental modal analysis
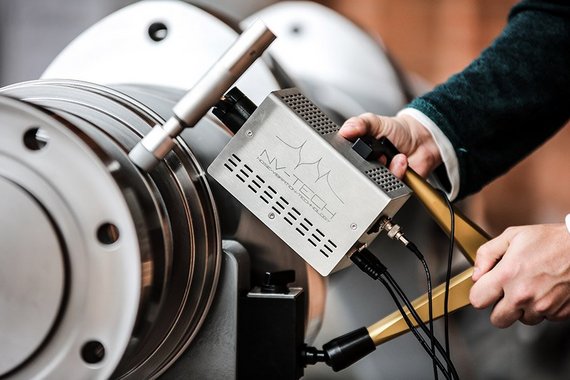
For vibration measurement and experimental modal testing, the underlying test structure needs to vibrate. Some test structures vibrate by themselves (motors or fans) and others need external excitation. For the first group operational modal analysis can be used to some extent, the second group is the typical subject of experimental modal testing. For such induced excitation in experimental modal analysis, there are different means. Typical excitation techniques in modal testing include excitation by shakers, broadband noise excitation by a loudspeaker or dedicated manual or automatic modal hammers. Some popular excitation signals for experimental modal analysis:
- Sine excitation is used to measure deflection shapes at one particular frequency
- Pseudo random signals are broadband excitation signals that show the same amplitude but random phase for each frequency
- Periodic chirp signals are a special type of pseudo random signals, differing by the phase of the individual sine signals, normally preferred when maximum excitation is required.
- White noise is a random signal with a flat spectrum adapted to the measured bandwidth
- and the automatic modal hammer excitation for a reactionless and repeatable force excitation.

Measurement solutions for experimental modal analysis
For further information, find these additional sites and learn about Polytec solutions for importing, measuring, comparing, evaluating, post-processing and documenting any modal test data. How does the non-contact technology of laser Doppler vibrometry work? How to perform 1D, single-point measurements or when to scan entire sample surfaces, maybe even in 3D? For complex shaped and larger structures, automated testing with robotics can significantly reduce testing time and cost. Polytec operates several structural test centers around the globe – in Waldbronn Germany, Plymouth, MI USA and Yokohama Japan for measurements as a service. Contact Polytec for individual modal analysis and modal testing projects.
